Recap
If you can only remember one thing, remember Figure.NZ
If you can only remember two things, remember to add /data.csv to Figure.NZ urls
Work together - explore Figure.NZ and Figure.NZ Places and find some data that surprises you.
Data processing
- Make a copy of your original data
Get started with Workbench
- Create a login
- Create a chicken chart
Do you need to reshape?
Sometimes data jobs like this:
| Year | Variable | Value |
|---|
| 2016 | tui | 10 |
| 2016 | kereru | 15 |
| 2016 | kākā | 8 |
| 2017 | tui | 12 |
| 2017 | kereru | 11 |
| 2017 | kākā | 13 |
When what you need is:
| Year | tui | kereru | kākā |
|---|
| 2016 | 10 | 15 | 8 |
| 2017 | 12 | 11 | 13 |
Then it is time for a reshape (pivot table in spreadsheet land).
- Select just the columns you need
- Decide whether it is long to wide or wide to long
- What’s the row column?
- What’s the variable column?
- Have we only got one year per row?
Titles, captions, and annotations
- You are journalists - embrace that
- A graph without a source isn’t a graph
What is a graph?
Using the tools at hand; size, colour, shape, and position to represent (encode) the values in the data.
Coloured pencil time
Exercise
Pick a couple of charts from Figure.NZ and remake them.
Datawrapper
Workbench Data is built for journalists
But the chart options are limited
But data can be exported directly from Workbench to Datawrapper
Create an account in datawrapper
Make sure your workbench workflow is public
Grab the data url
Maps
Data wrapper supports 3 types of map
- Choropleth
- Symbol
- Locator
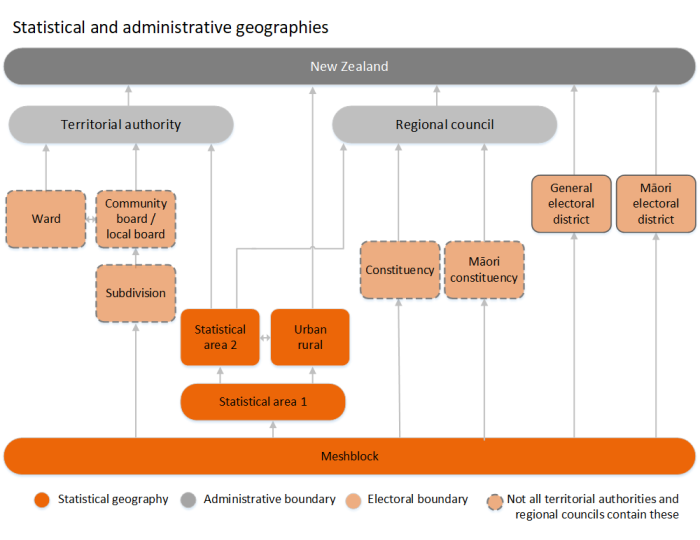
New Zealand is a mess (this doesn’t cover DHBs, Police Districts, Civil Defense, or Fire and Emergency areas)
Ask for help!