What is data journalism?
Paul Bradshaw from Birmingham City University says:
Data can be the source of data journalism, or it can be the tool with which the story is told — or it can be both.
The Bureau of Investigative Journalism says:
Data journalism is simply journalism.
The former is a new and trendy term but ultimately, it is just a way of describing journalism in the modern world.
Data journalism in New Zealand
The New Zealand Herald, Stuff, and RNZ all have specialist data journalists.
Nobody is trained as a data journalist - data journalists are either journalists who have
taught themselves more data analysis and visualisation or they have come from a data analysis
background into journalism
COVID-19 has changed the role of data journalism in many news organisations. Data is
becoming more prominent in live or daily news.
What does data journalism look like?
- The result of your data journalism might be just one sentence
- The result of your data journalism might be a big interactive
- Probably the result of your data journalism will be a few charts
Why do we need charts and visualisations?
- Often they are the best way to communicate things
- Summary statistics (mean/median) always hide things
Charts
The most important aspect of a chart is the words
Tip: Think about the alt-text
Chart choice
- Different charts will highlight different aspects of your data more effectively.
- Choose the chart that shows the aspect of the data that you are interested in
- Line and Bar charts are often a safe choice
- Take care with maps and pie charts
FT Visual Vocabulary
Bad or deceiving charts
- Charts and graphs can be used to deceive
The best way to get a sense for bad charts is to peruse vis.wtf or /r/dataisugly. There is also a good writeup here
The most common bad things are:
- Incorrect, missing, or misleading labels
- Inconsistenct scales
- Truncating scales
- Comparing things that shouldn’t be
- Too many things
Finding New Zealand data
There is a lot of open data available in and about New Zealand
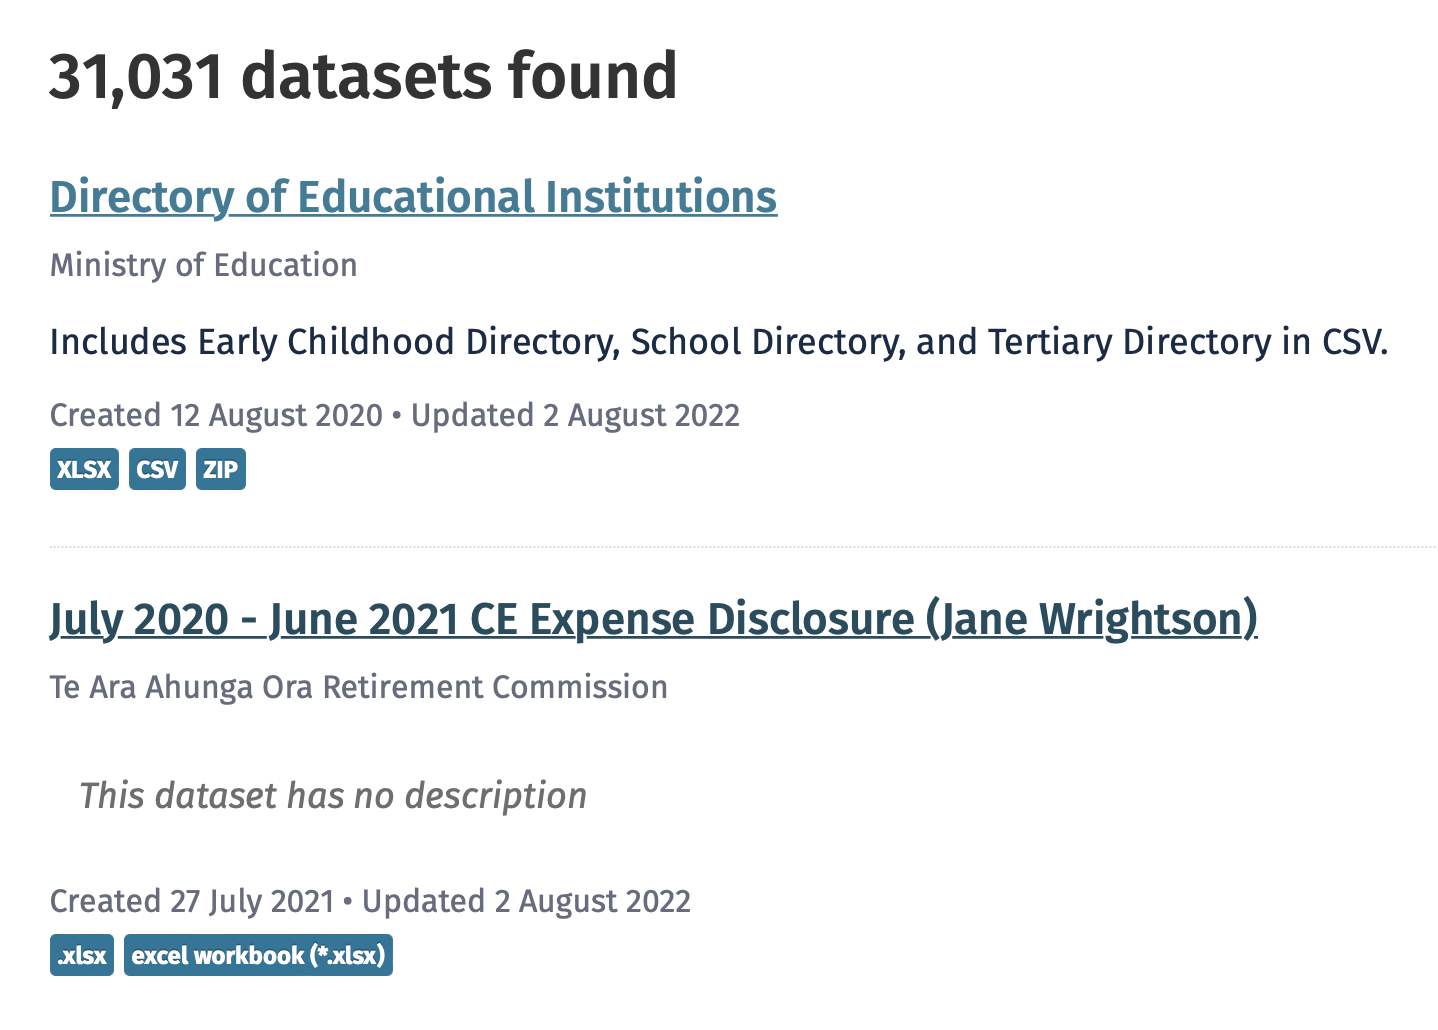
So that’s a lot!
- You might quickly find the problem is too much data
- So if you only remember one thing from this course
Figure.NZ’s mission is to get the people of New Zealand using data to thrive.
This includes being very happy to help journalists if you reach out with questions about New Zealand data
- Visual search
- Links to and documentation of original sources
- Clear licensing
- Reusable images
- Data downloads
Download just the data you see
If you can only remember two things - remember add /data.csv to Figure.NZ urls
Caveat
Sometimes the data used to create the chart you see is only part of a data set. So
don’t use data from /data.csv calculate percentages.
- Datawrapper
- Flourish
- Observable
- Learn to program
- R is probably the best language to learn for data journalism
- Javascript and Python as also valuable
- Find a community